Page Speed Comparison of Singapore Commerce
An online commerce store that offers a great user experience will satisfy the needs of its users and page speed performance is a driving factor to this. This is where Core Web Vitals comes into play. The Core Web Vitals aim to measure user experience. It is a set of metrics that Google uses to measure user experience and it has become one of their key factors in search result rankings. It is also a great way to compare your commerce store against your competitors.
How this will work
10 popular online commerce stores were chosen from Singapore. We will score them based on a scoring system (defined below) and for a few of the sites, we will go into detail on how they performed and what improvements can be made to improve their score.
How Scoring Works
- The scoring algorithm weighs values for the 3 metrics used in the Core Web Vitals: Largest Contentful Paint (LCP), First Input Delay (FID) and Cumulative Layout Shift (CLS).
- The metric with the lowest score is the final performance score.
- The data comes from the Chrome UX Report which is collected from real-world users over the last 28 days.
- It is an aggregated data over all form factors (desktop + mobile) and over all effective connection types.
The Performance Score
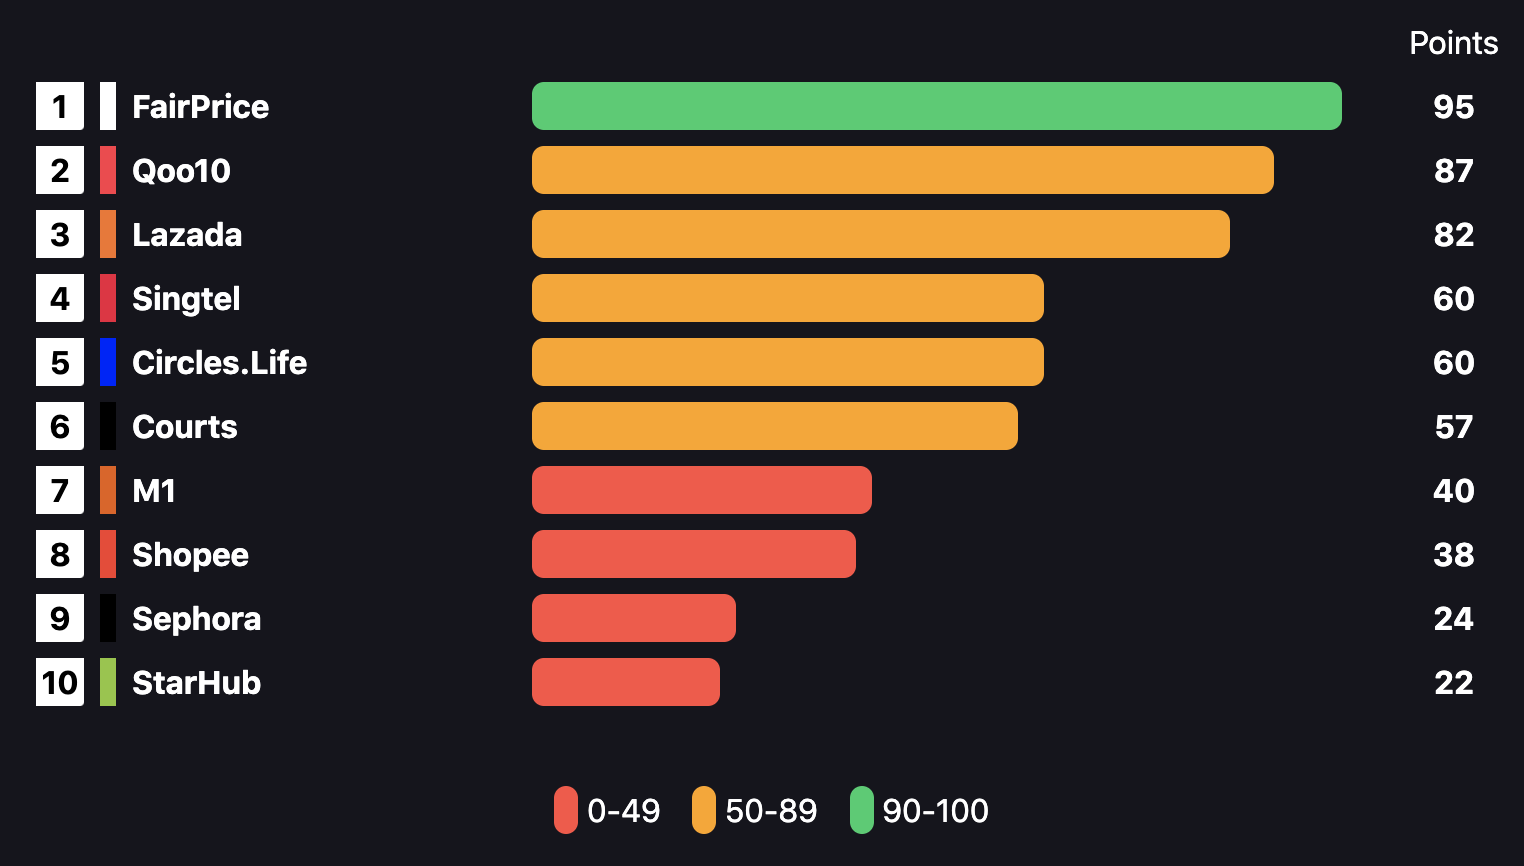
Live dashboard available at SG Page Speed Insights. You can check out the source code to see how the scores are calculated.
Analysing the stores in detail
We will use WebPageTest and Chrome Dev Tools to analyse a few of these online stores and look at any areas of improvement that can help improve their scores. The test location of the WebPageTest test run will be Singapore and Chrome will be the browser.
I’ve chosen 3 sites from different markets:
- FairPrice (Grocery Retailer)
- Sephora (Beauty and Cosmetics)
- Circles.Life (Telecommunication)
FairPrice
URL: https://www.fairprice.com.sg/

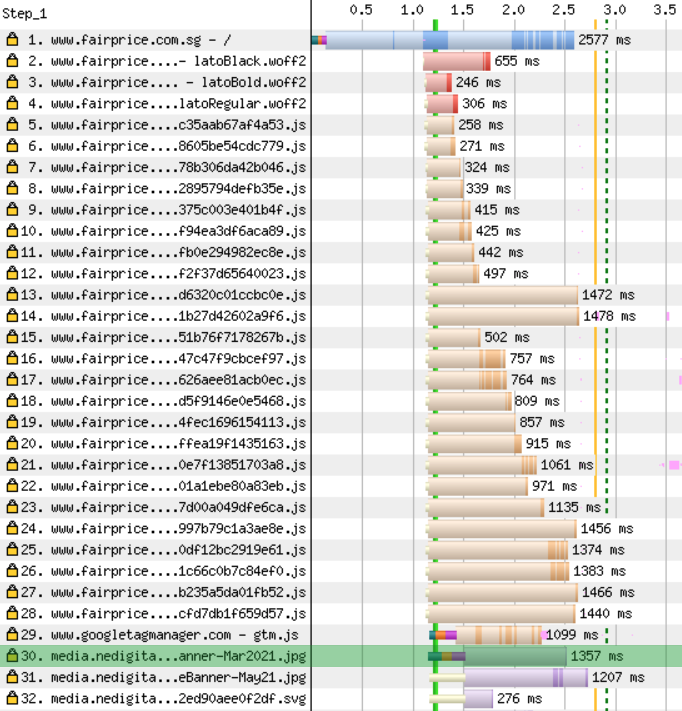
We will start by looking at the request waterfall:
Possible Improvement - Remove unused JavaScript
The site is built using Next.js which is packed with features to help with performance. A noticeable feature is Dynamic Importing which we can see from their chunk requests. By using Chrome Dev Tool’s Coverage feature, let us see how much of these chunks are being used:
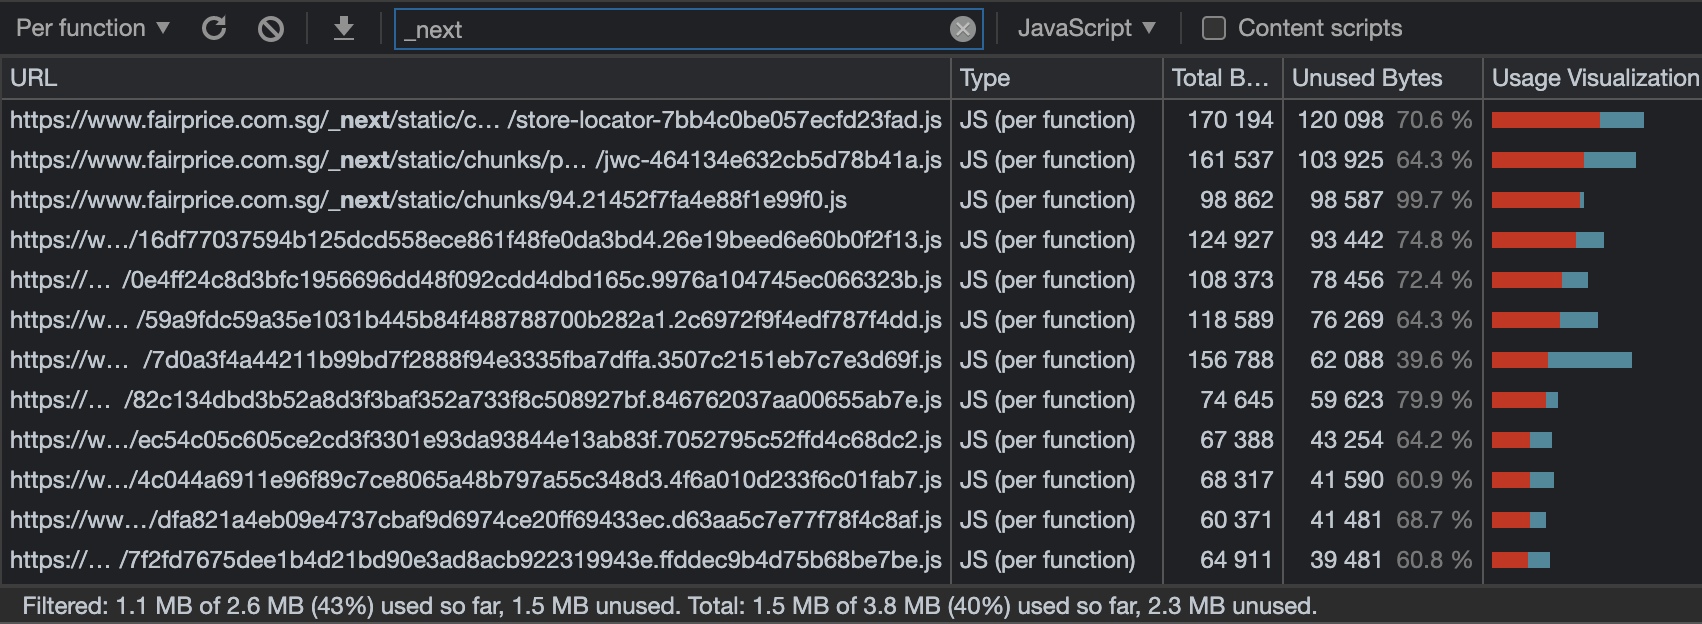
1.5 MB (57%) of the chunks are not being used on page load. Reducing the amount of bytes the user needs to download will save the bandwidth and result in rendering the page faster.
Possible Improvement - Reduce HTML Size
Lets look at the very start request waterfall again:
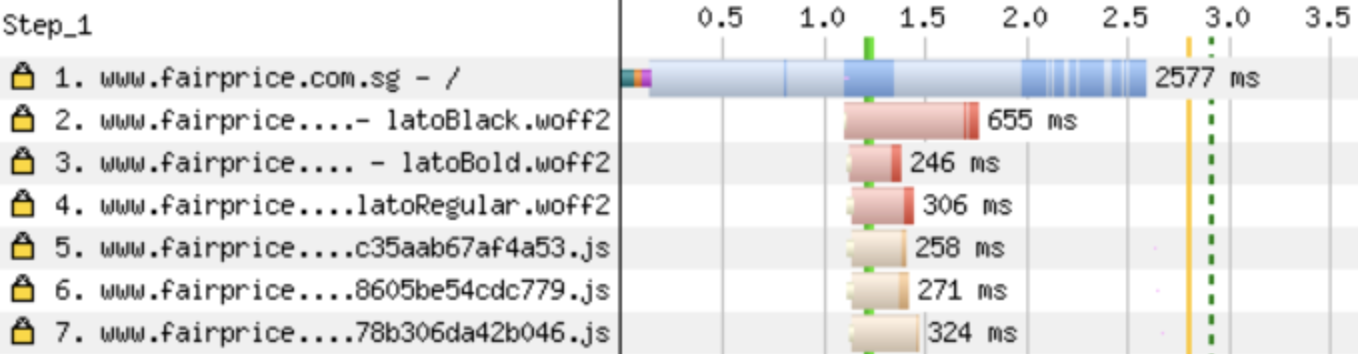
What we see here is that the page didn’t render until around the 1.2s mark. The green vertical bar represents the start of first render. The browser is smart enough to render HTML while it is still downloading the rest of it. This tells us that there was no render-blocking resources - that is a good thing!
There are two questions here though - why did it take 1.2 seconds to start rendering, and why did the HTML take 2.5 seconds to finish downloading? The answer could possibly be because of the size of the HTML - it is 269kb of compressed size. If we open up the HTML to see why its so large, we see the server side generated page content and if we look a little deeper down towards the end of the page, we can see a very large JSON script tag used in Next.js applications.
The site is server side rendered using Next.js - once the page has been rendered, the browser needs to take over control of the page and this is called Hydration. The browser needs to understand the components being rendered and for that it requires the data that was used to generate this page. Next.js provides this through a JSON payload found in the HTML (the script has an ID __NEXT_DATA__). If we grab this JSON from the website and run it through JSON Size Analyzer we can examine what sort of information is being send in the HTML.
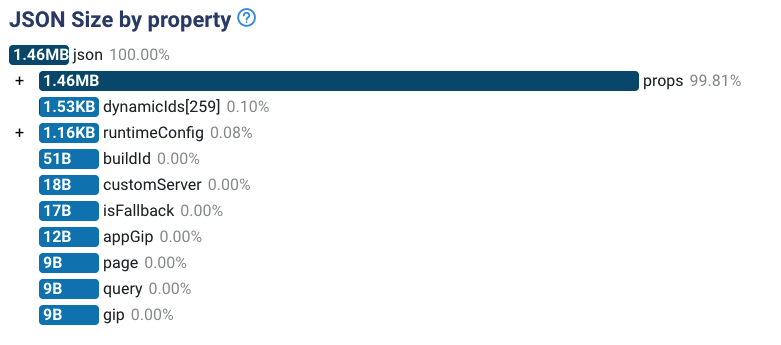
That’s a pretty huge JSON embedded in the HTML. There is a big win for FairPrice if they can cut this down to only what is required for the content that appears on the top half of the page (and then client-side fetch the rest after page load).
If you look up again at the requests up above, row 30 (highlighted in green) is their home banner, the image that is their largest contentful paint. Here it is again:
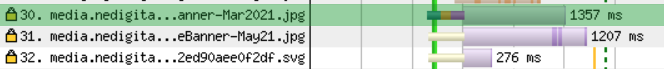
That thin bar at the start of the request is the connection setup. This occurred because it is the first connection made to this server (this image is hosted on a different domain). FairPrice made an attempt to start this connection setup earlier by using preconnect and dns-prefetch:
<link rel="preconnect" href="https://media.nedigital.sg" />
<link rel="dns-prefetch" href="https://media.nedigital.sg" />
This connection setup could have started earlier if the HTML was received earlier. You see the thin yellow bar at the start of Row 31 and 32? The browser knew about these requests too but it is also waiting for the same connection setup to start downloading the other images. If they cut down the time it takes for the HTML to download, then these image potentially render earlier.
Another method to avoid this connection setup is to move the largest contentful paint to the same server. Either technique can improve their LCP score (which is right now their lowest mark in their Core Web Vital audit).
Possible Improvement - Profiling the layout shift

Above is 2 frames that occurred when the layout shift happened. We can see the font loading and the lazy loading of products (in the bottom-right corner) is causing the layout shift and resulting in the low CLS score.
By examining the frames of your page loading, you could understand more of the experience your user is facing and find any unexpected layout shifts. Reducing the layout shift will improve your audit score. WebPageTest is a great tool to grab these frames and highlight where the layout shift occurs.
Sephora
Two areas we will look at for Sephora is their layout shift and the delay in the largest contentful paint. Let’s start with the waterfall request:
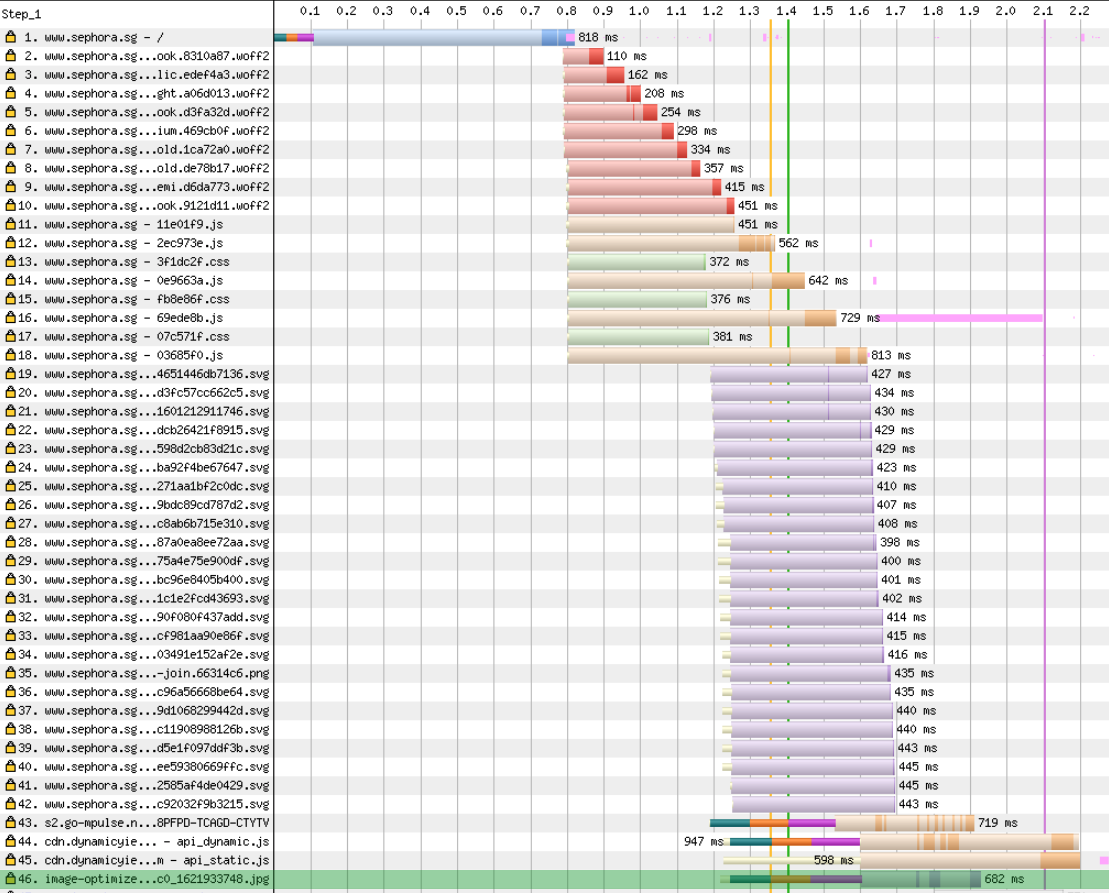
Possible Improvement - Reduce render-blocking font files
9 font files were loaded as highest priority from the <head> which is render-blocking. Sephora has split the fonts by weight and style into separate font files. If we loop through all the elements on the page and list down their font usages (using some quick JavaScript) we can see the usages of these 9 font files:
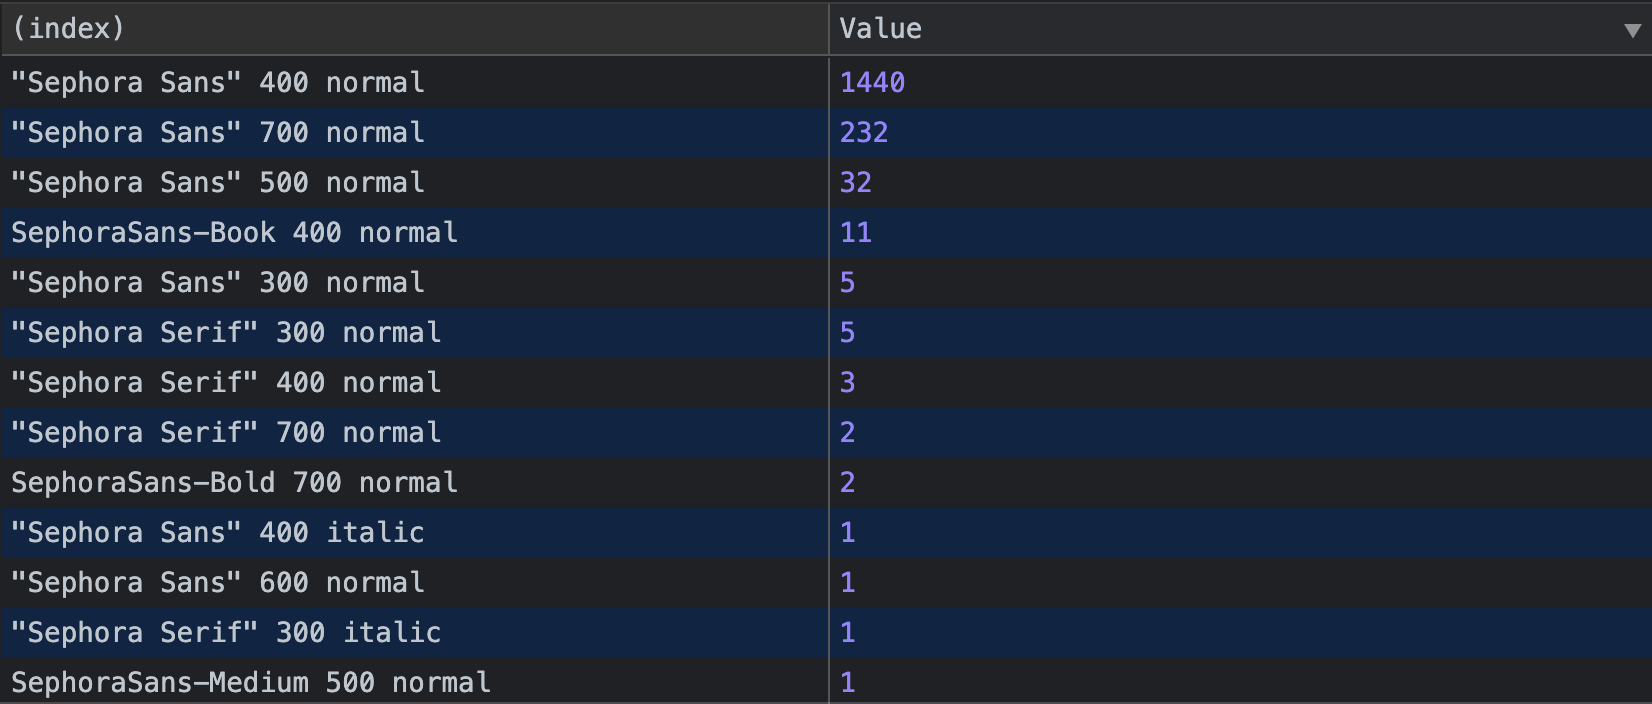
The most fonts used are: “Sephora Sans 700” (83% of the page) and “Sephora Sans 400” (13% of the page). Avalon isn’t loaded on this page but 2 render-blocking assets for this font is loaded.
If Sephora is certain they need this many fonts for the landing page, it will come with a heavy cost of delayed page load. If the Sephora brand is okay with an alternative - they can swap out the other 58 elements (4% of the page) to use the same fonts. They can then remove 7 font files that was holding up page rendering.
Possible Improvement - Remove unused JavaScript
We can use Chrome Dev Tools to see how much of that JavaScript is being used on the first page:
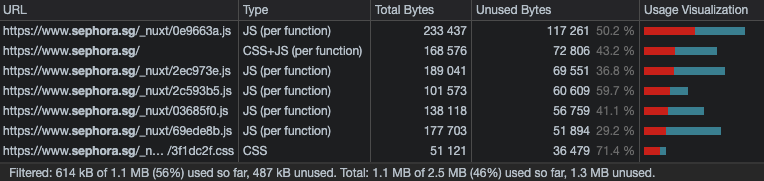
1.3 MB (54%) of JavaScript was not used on the page load. Let’s look at the requests again:
Because the JavaScript resources are render-blocking, the rest of the page requests such as images and SVGs didn’t load until the JavaScript finished downloading. If we can reduce the size of the JavaScript bundles, the rest of the page can continue rendering earlier.
Alternatively, we can async or defer the scripts if they are not required to render the first paint. These attributes will tell the browser it can continue rendering the HTML while it loads these scripts in the background. Here is a great article on Efficiently load third-party JavaScript that details how these attributes work.
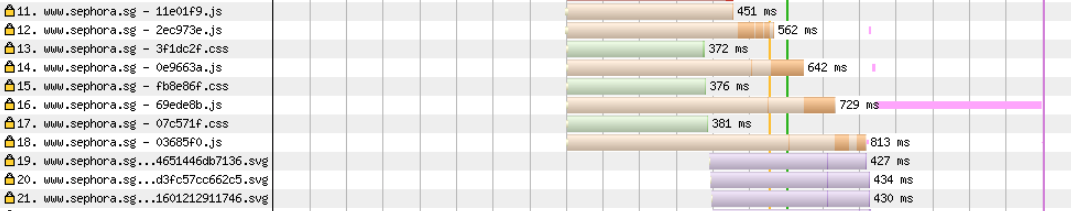
Possible Improvement - Preconnect the hero banner

The main image is highlighted in green (Row 46). That thin line at the start of the request is the connection setup, which costed 400ms. This happened because of the new domain request (It looks like it sits behind an image optimization server). Sephora can shave some time off the request if they moved it to the same domain, or preconnect to this other domain like so:
<link
  rel="preconnect"
  href="https://image-optimizer-reg.production.sephora-asia.net" />
<link
  rel="dns-prefetch"
  href="https://image-optimizer-reg.production.sephora-asia.net" />
This would allow the connection setup to happen earlier while the browser was working on other parts of the rendering.
Circles.Life

This one was fun to examine - we can see in the video strip above that the areas we should tackle is the layout shift and the background image.
Possible Improvement - Optimise images for the web
Let’s look at the request waterfall:
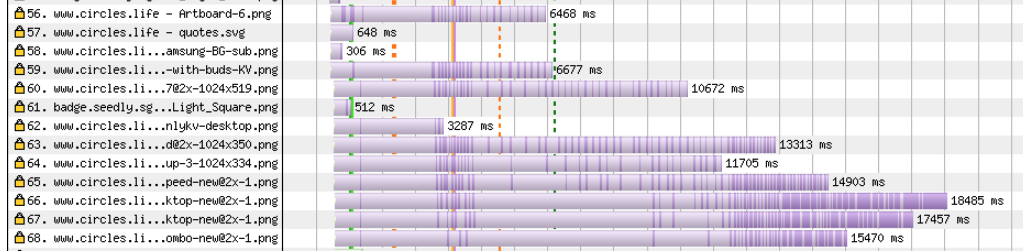
This section of the requests stood out the most. The images on this page can do with some optimization. 21.5 MB of images was loaded on the landing page. If you’re looking for the right tool, squoosh.app is the way to go! Let’s try it on the main image that appear above-the-fold:
Original: 300kb

Optimised: 150kb (50%)

I’m not a designer so the optimised image might not be ideal to the designer of this image, but they can tweak the settings to find an acceptable level of quality for this image.
This was the only image visible to the user on page load (above-the-fold). The other 20MB worth of images are found below-the-fold or hidden from the user entirely. This means Circles.Life can defer these off-screen images until they are in the viewport. This can be done using loading=“lazy” on the <img />. Circles.Life can also use a lazy-load WordPress plugin too.
Possible Improvement - Reduce render-blocking scripts and stylesheets
A <script> tag that is in the <head> without a defer or async attribute is a render-blocking script. This is mostly the resources in the waterfall request that appears before the first render.
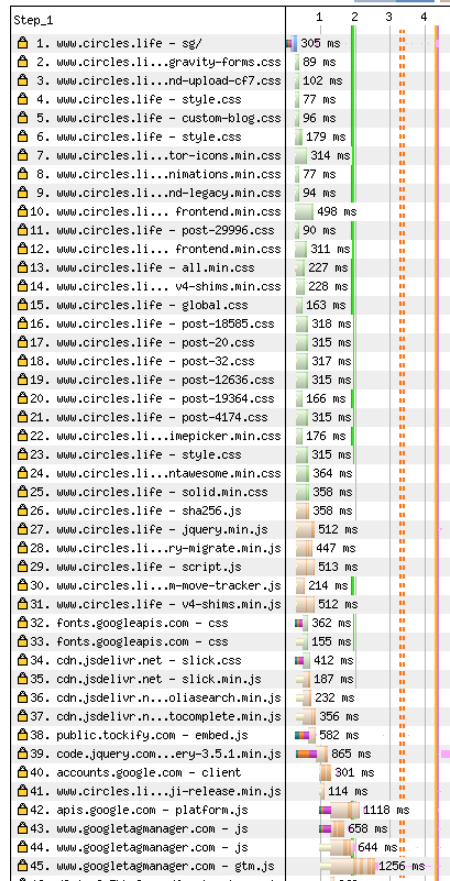
If any of these scripts are not critical code for first render, they should be marked with async or defer attributes. Any code not used on this page should be removed. If they are required and are located on a different server, we can prepare the browser for what is coming with <link rel="preload">.
Same goes with stylesheets - if a <link rel="stylesheet"> does not have disabled or media attribute that matches the user’s device, it is considered render-blocking. Identify the critical styling required for first render and keep it in the head. Then load the rest afterwards.
Possible Improvement - Avoid render blocking fonts
The site loads a handful of Google Fonts that we can optimise. We can start by pre-connecting the connection setup to Google. This tells the browser to prepare for the download of the font before it is requested:
<link rel="preconnect" href="https://fonts.gstatic.com" />A stylesheet is required to load the Google fonts. We can avoid it from being render-blocking by switching rel="stylesheet" to rel="preload":
<link
  rel="preload"
  as="style"
  href="https://fonts.googleapis.com/css2?family=Open+Sans:300,300i,400,400i,600,600i,700,700i,800,800i" />
This technique can be used with any fonts. Harry goes in depth in The Fastest Google Fonts.
Summary
The Core Web Vitals aim to measure user experience. The metrics are insightful and improving the scores will have a great result on your users. Pairing the information Page Speed Insights provides with the performance test results from WebPageTest, developers have the data they need to analyse possible improvements they can make to their websites.
By learning from the websites above, the possible improvements that we found:
- Preconnect early
- Optimise images for the web
- Reduce HTML Size
- Reduce render-blocking font files, scripts and stylesheets
- Remove unused JavaScript and CSS
I want to know more!
- Optimize WebFont loading and rendering
- Preload: What Is It Good For?
- Preconnect to required origins
- Find Unused JavaScript And CSS With The Coverage Tab
- CSS Font Loading API
- Who has the fastest F1 website in 2021? Part 1
Thank You
- Jake Archibald for his amazing lessons on performance testing websites.
- Treo.sh for the scoring technique.